Analytics, part 1 — Experienced users
When a user shares data with Cool Maze - Push to Computer for the 15th time, the server doesn’t know what data was shared, thanks to encryption. However, we do know that this is the 15th share action from that particular app installation, along with other anonymous metrics. This allows us to perform data analysis and observe differences in the behavior of “newcomers” versus “experienced users.”
Scan duration
The “scan duration” is the elapsed time between the start of the mobile share intent, and the detection of the QR code. First-time users have a 60% probability of scanning the QR code, compared to 94% for experienced users. When new users do scan successfully, their median scan time is 5.1 seconds, while experienced users take only 2.7 seconds.

The right end of the chart represents the 50th action by the same device. The numbers are aggregated across the entire user base.
Number of resources
Did you know you can share multiple photos in a single action? Over time, users tend to share more resources at once.

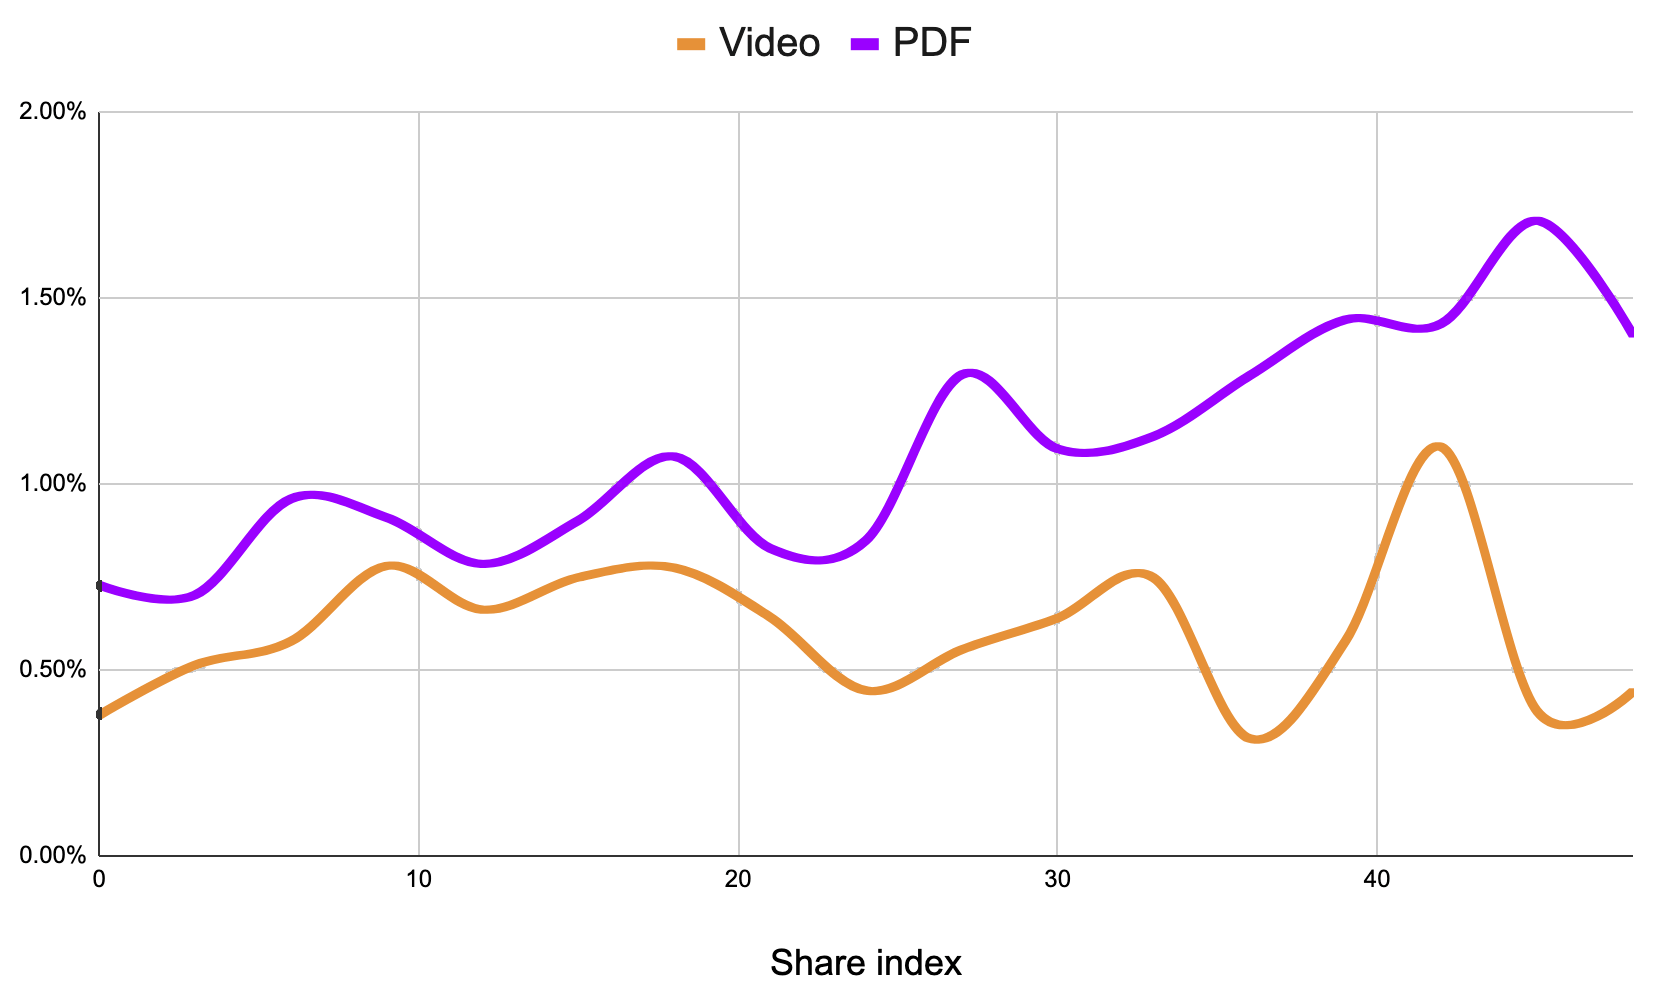
Resource mime types
Cool Maze - Push to Computer isn’t just for photos; you can also share short videos. We’ve noticed that experienced users share more PDF files, which account for 1.5% of the resources they transfer.
Two paths in iOS
There are two ways to share a photo using the Cool Maze - Push to Computer iOS app:
- The “In-app” flow: open the app, tap the Share button, then select the photo.
- The “Share extension” flow: open your Photos app, tap the “Share with” button, then select Cool Maze - Push to Computer.
A first-time iOS user is more likely to use the in-app flow (60% of the time). However, experienced iOS users overwhelmingly prefer the more powerful “Share extension” experience, using it 90% of the time.
